Epigenetics
Hi-C Based Chromatin Interaction
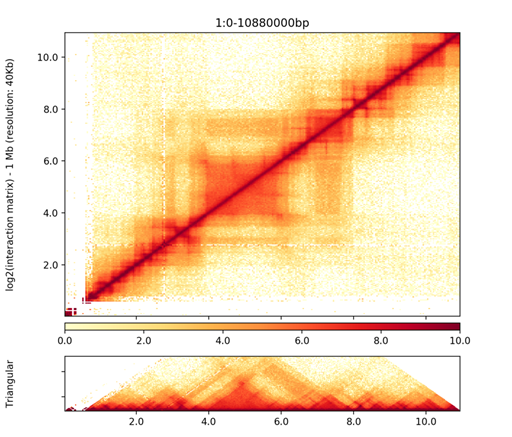
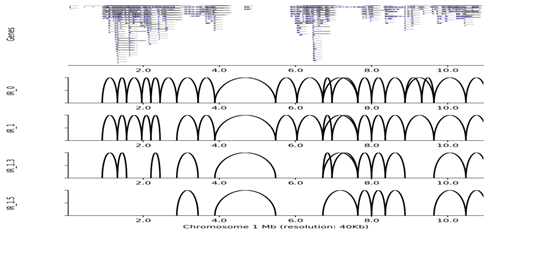
Hi-C based chromatin interaction은 세포 내 DNA가 3차원적으로 어떻게 접히고 상호작용하는지를 분석하는 유전체 구조 연구 기술입니다. 이 방법은 염색질(Chromatin)이 서로 멀리 떨어져 있는 DNA 영역들이 실제로 공간적으로 가까이 위치해 상호작용하는지를 탐지하기 위해 교차결합(crosslinking) → 제한효소 절단 → 재결합(ligation) → 시퀀싱(Sequencing) 과정을 거쳐 DNA-DNA 접촉 정보를 얻습니다. 이를 통해 유전체 내 전사 조절 영역(promoter, enhancer) 간 상호작용, 염색질 도메인(TAD, Topologically Associating Domain) 구조, 유전자 발현 조절 메커니즘을 규명할 수 있습니다.
Service Features
| Platform (Library) | Illumina Novaseq (PE150) |
|---|---|
| Sample Type | Tissues |
| Sequencing Data |
Hi-C library Chromatin loop: 150x TAD: 50x |
| Turnaround Time | ~4 weeks after sample QC |
| Analyzable Species | Human, Animal |
Service Progress


Data Analysis
Hi-C chromatin interaction은 발달생물학, 암유전체학, 후성유전학(epigenetics) 등에서 유전자의 공간적 조절 원리를 밝히거나, 구조적 변이(Structural variation)와 질병 간 연관성을 분석하는 데 널리 활용됩니다.
Demo Results
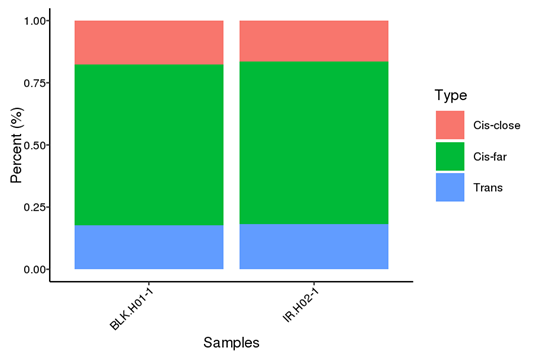
Cis and Trans Proportion distribution
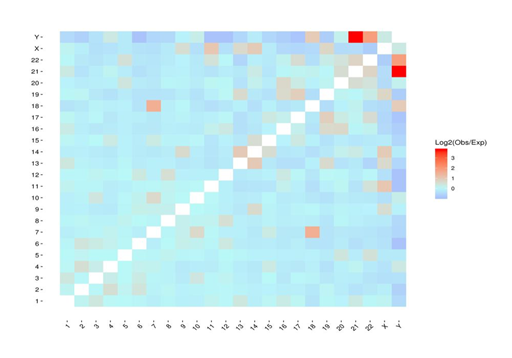
Heatmap of chromosomal interactions
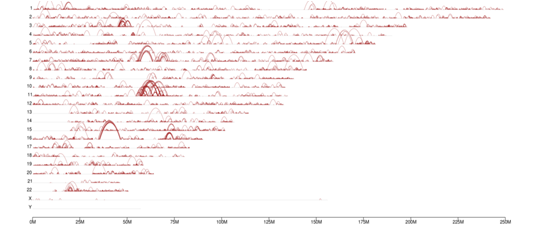
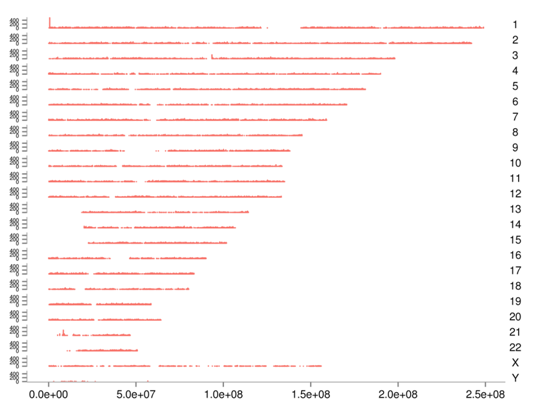
Genome-wide distribution of loops
Visualization of TADs
Visualization of TADs (continued)
Epigenetics
ATAC-Sequencing
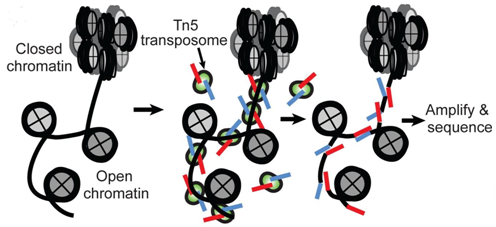
ATAC sequencing (Assay for Transposase-Accessible Chromatin sequencing)은 세포 내 염색질의 개방 정도(chromatin accessibility)를 분석하는 기술로, 전사 조절에 활발한 유전자 영역을 식별하는 데 사용됩니다. 이 방법은 Tn5 전이효소(transposase)를 이용해 염색질이 열려 있는 DNA 부위에 시퀀싱 어댑터를 삽입하고, 그 영역을 시퀀싱하여 전사 인자 결합 부위, enhancer, promoter 등 조절 요소를 지도화합니다.
Service Features
| Platform (Library) | Illumina Novaseq (PE150) |
|---|---|
| Sample Type | Tissues, live or frozen cells, and blood |
| Sequencing Data | >20M reads (Depending on Genome Size, Human: 50M reads) |
| Turnaround Time | ~4 weeks after sample QC |
| Analyzable Species | Human, Animal, Insects |
Service Progress
Data Analysis
ATAC-Seq은 DNase-seq이나 FAIRE-seq보다 시료가 적게 필요하고 분석 속도가 빠른 장점이 있습니다. 유전자 발현 조절 영역, 세포 분화 및 발달 과정 분석, 암과 같은 질환의 후성유전학(epigenetic) 변화 탐지, 단일세포 수준의 염색질 구조 연구까지 다양한 생명과학 및 의생명 연구 분야에서 활발하게 활용됩니다.
Demo Results
Overview of ATAC-Seq
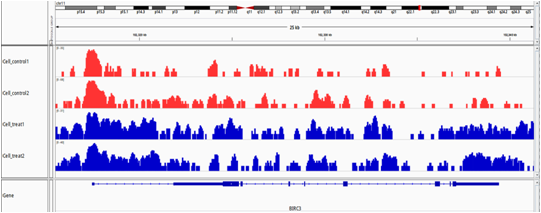
IGV Visualization
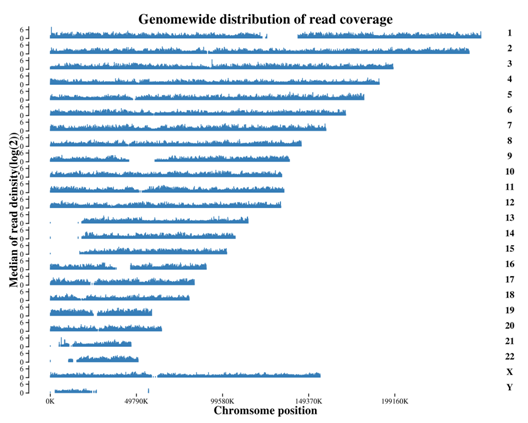
Genome-wide distribution of loops
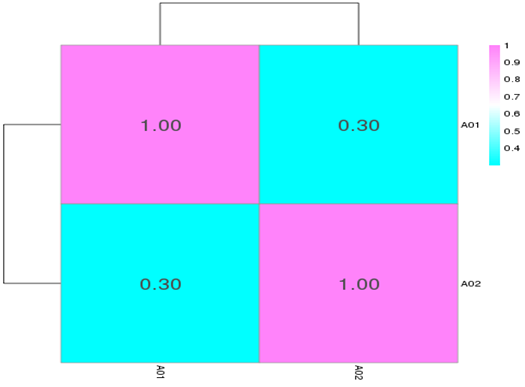
Sample correlation
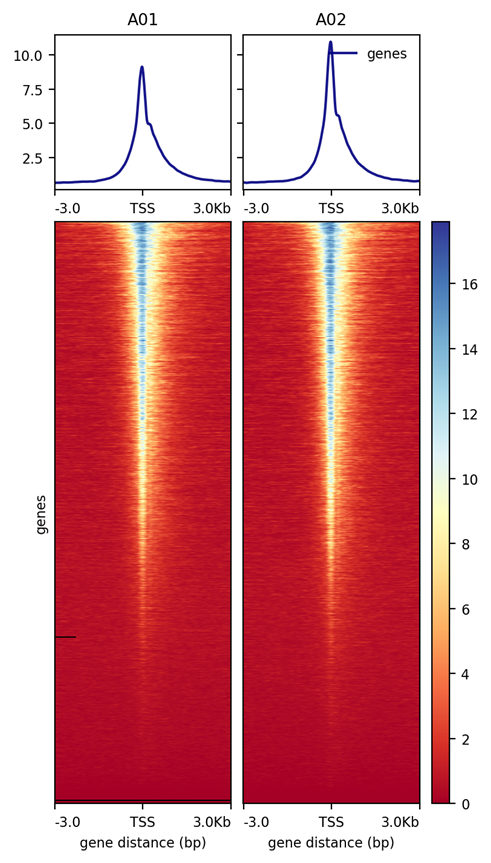
Evaluation of enrichment of Seq Data Near TSS
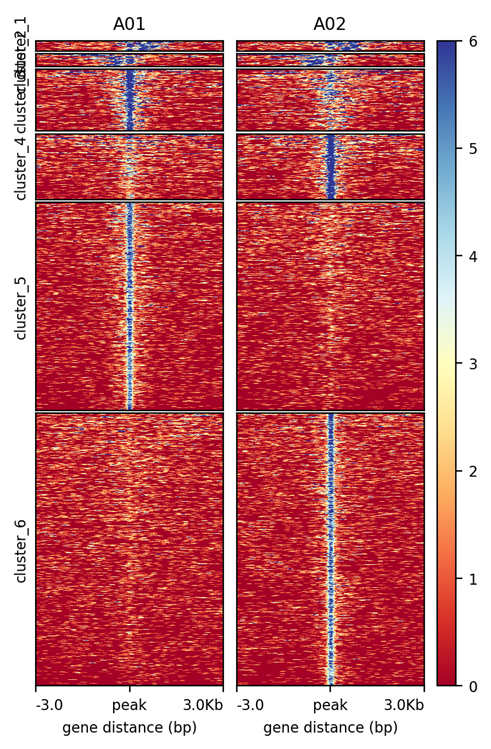
Clustering of differential peaks
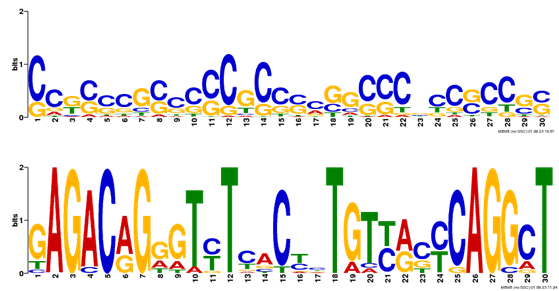
Motif identification
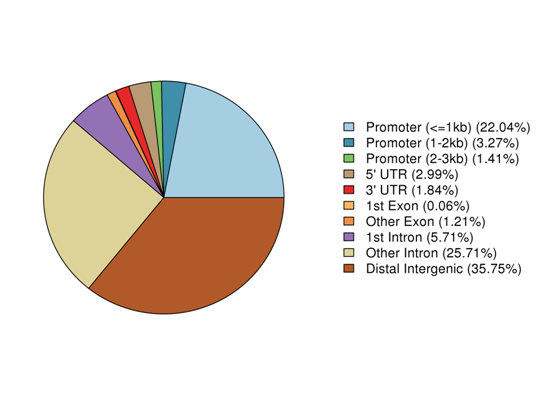
Distribution of differential peaks
Epigenetics
Whole Genome Bisulfite Sequencing (WGBS)
Whole Genome Bisulfite Sequencing (WGBS)는 유전체 전반의 DNA 메틸화(DNA methylation) 패턴을 염기 단위(single-base resolution)로 분석하는 가장 정밀한 시퀀싱 기술입니다. 이 방법은 bisulfite treatment를 통해 메틸화되지 않은 Cytosine(C)을 Uracil(U)로 전환시키고, Methylation된 Cytosine(Cm)은 그대로 남도록 하여 시퀀싱 후 두 서열을 비교함으로써 메틸화 수준을 정확히 파악합니다.
Service Features
| Platform (Library) | Illumina Novaseq (PE150, Bisulfite treated) |
|---|---|
| Sample Type | Tissues |
| Sequencing Data | 30x Depth |
| Turnaround Time | ~4 weeks after sample QC |
| Analyzable Species | Human, Animals |
Service Progress
Data Analysis
WGBS 기술을 통해 세포나 조직의 후성유전(epigenetic) 조절 상태, 유전자 발현 조절 메커니즘, 발달 및 질병 과정에서의 메틸화 이상 등을 연구할 수 있습니다. 특히 암 유전체학, 발달생물학, 노화 연구, 줄기세포 분화, 환경유전학 등에서 유전체 전반의 후성유전 변화를 탐지하고 비교 분석하는 데 널리 활용됩니다.
Demo Results
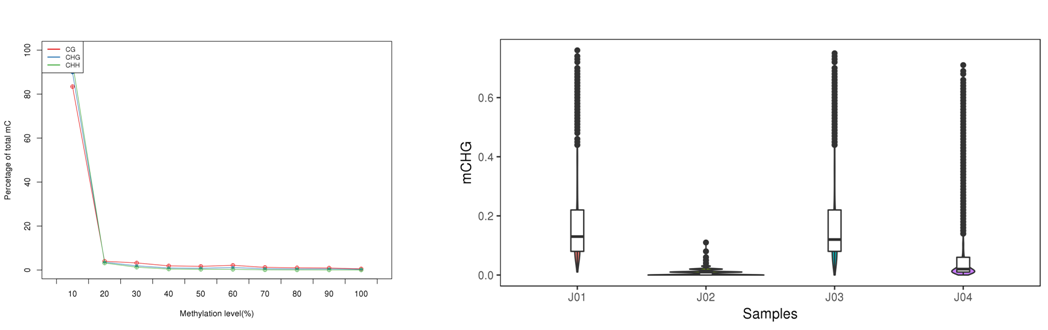
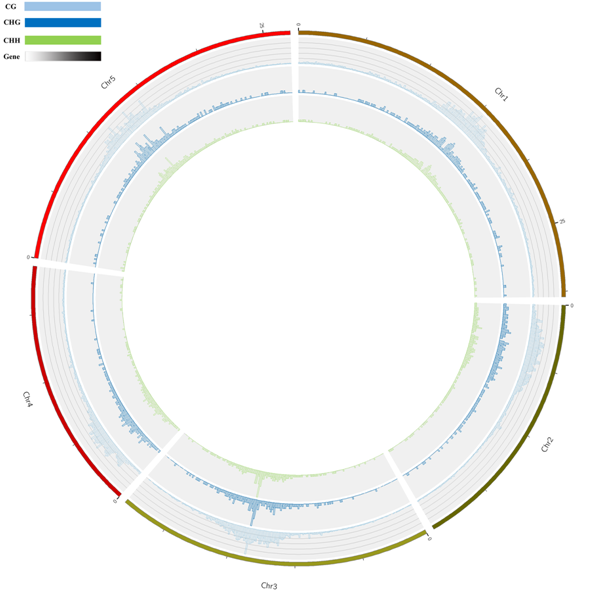
Methylation level
Analysis of near mC
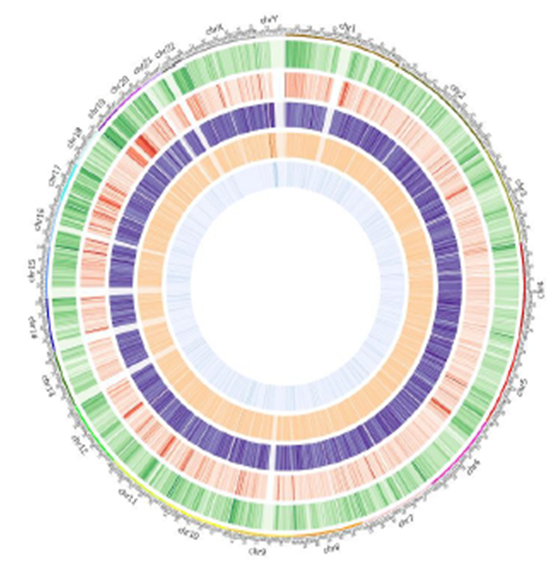
Methylation Map
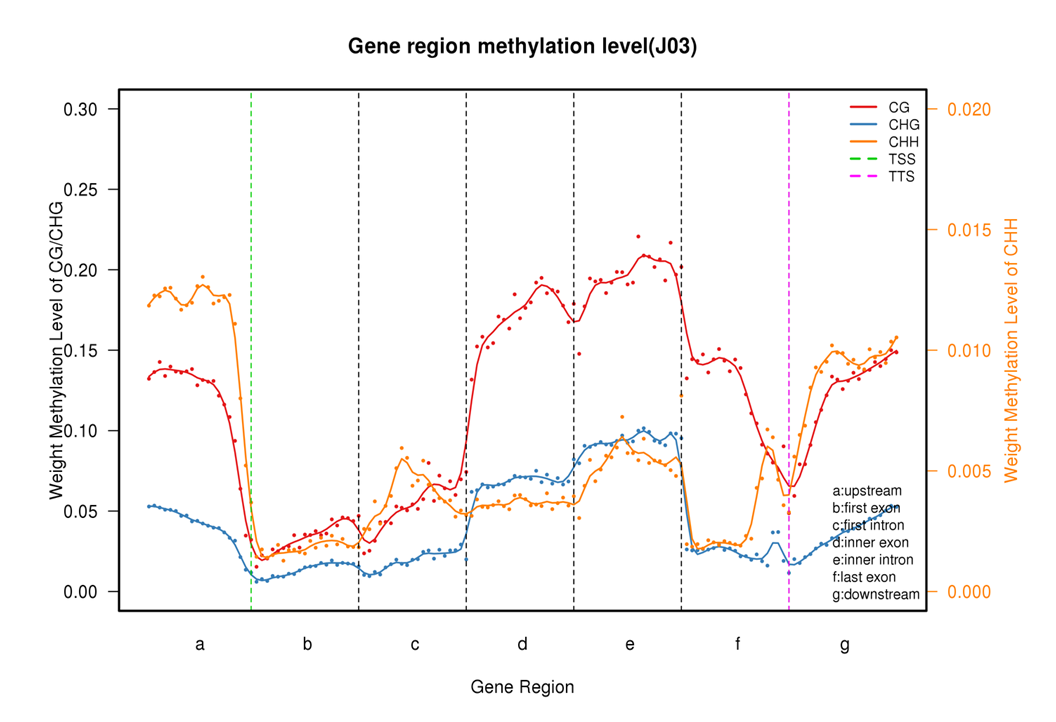
Gene region methylation level
Methylation distribution
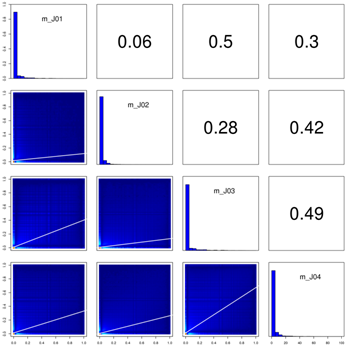
Correlation Analysis
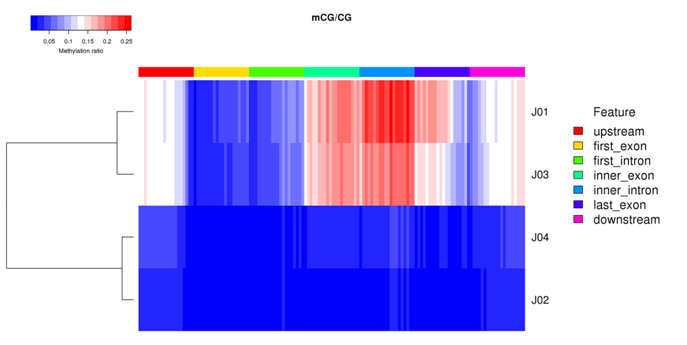
Clustering Heatmap
Epigenetics
Reduced Representation Bisulfite Sequencing (RRBS)
Reduced Representation Bisulfite Sequencing (RRBS)은 전체 유전체를 대상으로 하는 WGBS의 데이터량과 비용 부담을 줄이기 위해 제한된 부분 유전체 기반 DNA 메틸화 분석 기술입니다. 이 방법은 제한효소(MspI)로 CpG가 풍부한 영역(CpG islands)을 선택적으로 절단한 뒤, T 조각들만 비스울파이트 처리(bisulfite conversion)와 시퀀싱을 수행함으로써, 메틸화가 집중된 유전자의 프로모터(promoter)와 조절 영역(regulatory regions)을 효율적으로 분석합니다.
Service Features
| Platform (Library) | Illumina Novaseq (PE150, MspI digested and Bisulfite treated library) |
|---|---|
| Sample Type | gDNA |
| Sequencing Data | 8Gb |
| Turnaround Time | ~4 weeks after sample QC |
| Analyzable Species | Human, Animal, Insects |
Service Progress
Data Analysis
RRBS는 상대적으로 적은 시료와 비용으로 높은 CpG 커버리지와 정확도를 제공하며, 암 메틸화 바이오마커 발굴, 세포 분화 및 발달 연구, 질병 관련 후성유전 조절 연구, 환경적 요인에 의한 DNA 메틸화 변화 분석 등에서 폭넓게 활용됩니다.
Demo Results
Methylation map

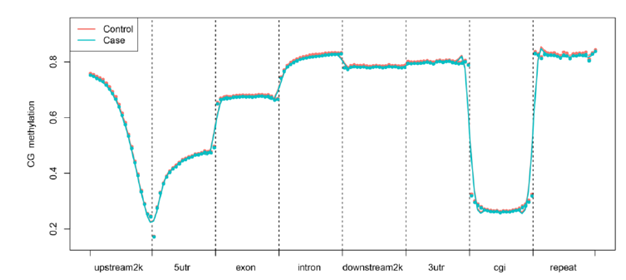
CG Methylation level
Correlation analysis
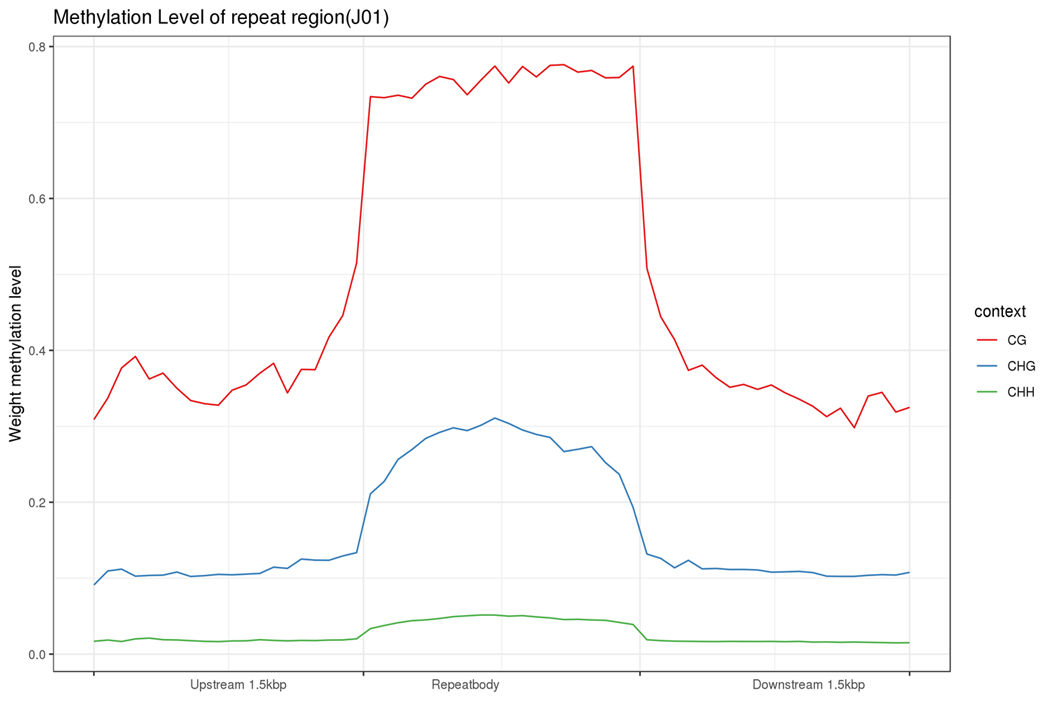
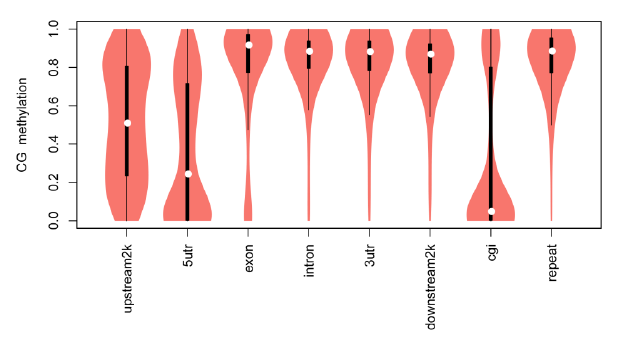
Functional elements methylation
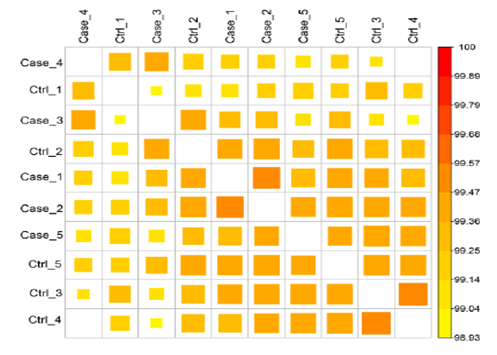
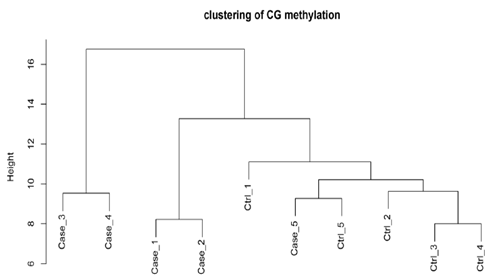
Clustering analysis (CG methylation)
Epigenetics
Chromatin Immunoprecipitation Sequencing (ChIP-Seq)
Chromatin Immunoprecipitation Sequencing (ChIP-Seq)은 단백질과 DNA의 상호작용(protein-DNA interaction)을 분석하기 위한 기술로, transcription factor나 histone modification이 유전체 상에서 결합하는 위치를 시퀀싱을 통해 규명합니다. 실험은 먼저 단백질-DNA 복합체를 교차결합(crosslinking) 한 뒤, 특정 단백질에 대한 antibody를 이용해 복합체를 면역침강(immunoprecipitation)시키고, 그에 결합된 DNA를 차세대 시퀀싱(NGS)으로 분석하는 방식으로 수행됩니다.
Service Features
| Platform (Library) | Illumina Novaseq (PE150, Purified DNA after Immunoprecipitation) |
|---|---|
| Sample Type | Tissues |
| Sequencing Data | 10Gb |
| Turnaround Time | ~4 weeks after sample QC |
| Analyzable Species | Human, Animals |
Service Progress
Data Analysis
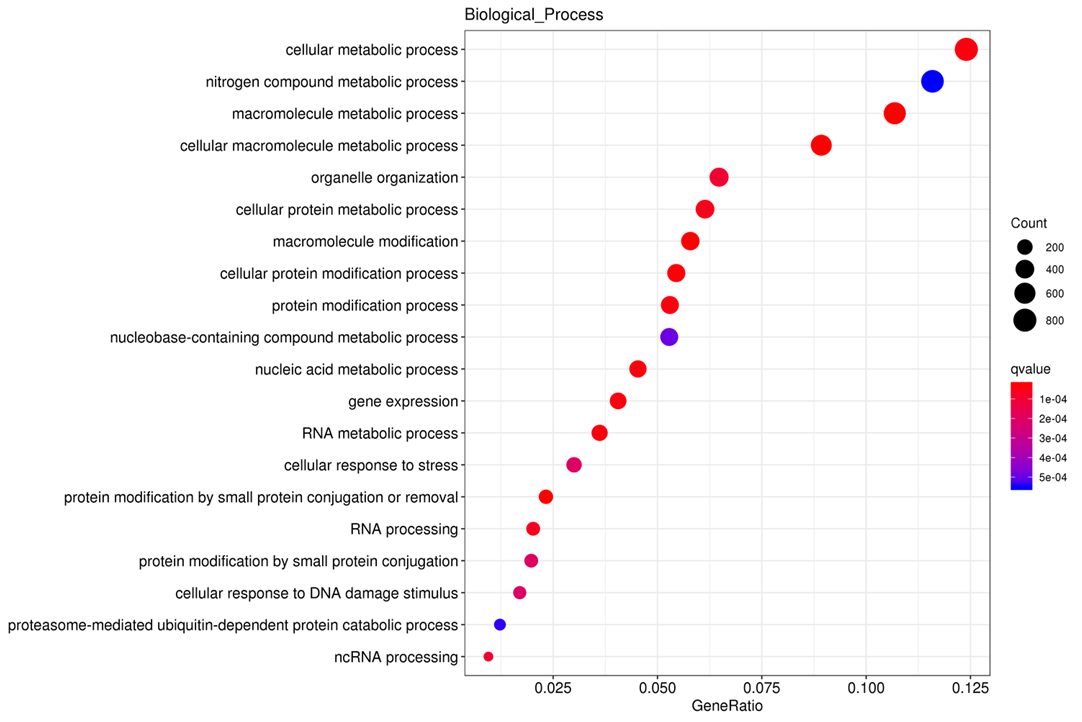
Transcription network, Epigenetics, Gene Expression 제어 메커니즘을 정밀하게 파악할 수 있습니다. ChIP-Seq은 발달생물학, 암유전체학, 줄기세포 연구, 염색질 구조 분석 등에서 Transcription factor와 Histone 구성 및 역할을 밝히는 핵심 도구로 활용됩니다.
Demo Results
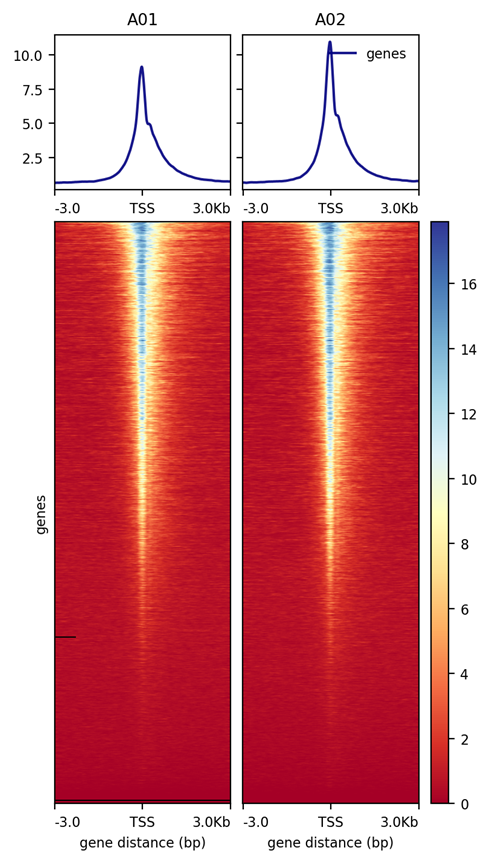
Evaluation of enrichment of Seq Data Near TSS
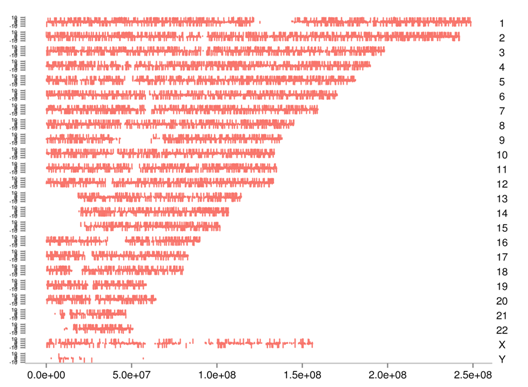
Genome-wide Distribution of ChIP peaks
Classification of peak regions
Functional Enrichment of peak-related genes (KEGG)